Your Influence software has an in-built KPI (Key Performance Indicator) reporting function. This allows users to analyse figures stored by the system for rates such as Candidates added, Clients added, CVs sent or Matches created.
All the figures are generated from the JOURNALs and logs that are created each time an action is performed within Influence. i.e. If it wasn’t done through Influence, it isn’t counted. Therefore you should encourage all consultants to send CVs, book interviews, etc., through Influence in order to collate your figures.
How to run the KPI data reporting
The reporting is a two-stage process. Data is imported from the system into the KPI data module, and then a separate option is used to allow analysis of that data.
Step 1: Import the latest data.
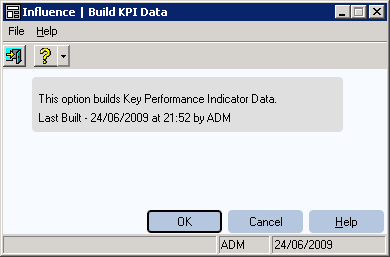
Go to Maintenance > Reporting > Build KPI data.
The system will display a dialogue box stating the last time the figures were updated. (any activity after this date such as placments, Cvs sent, new candidates added etc. will not be reflected in the figures until after they are rebuilt)
Clicking [OK ] will import data up-to the time you run the import and bring the figures up-to-date.
| Tip: It is often a good idea to do this either weekly (perhaps every Friday) or Monthly (last day of the month |
Step 2: Analyse the KPI Data
Go to Maintenance > Reporting > Key Performance Indicators (KPI’s).
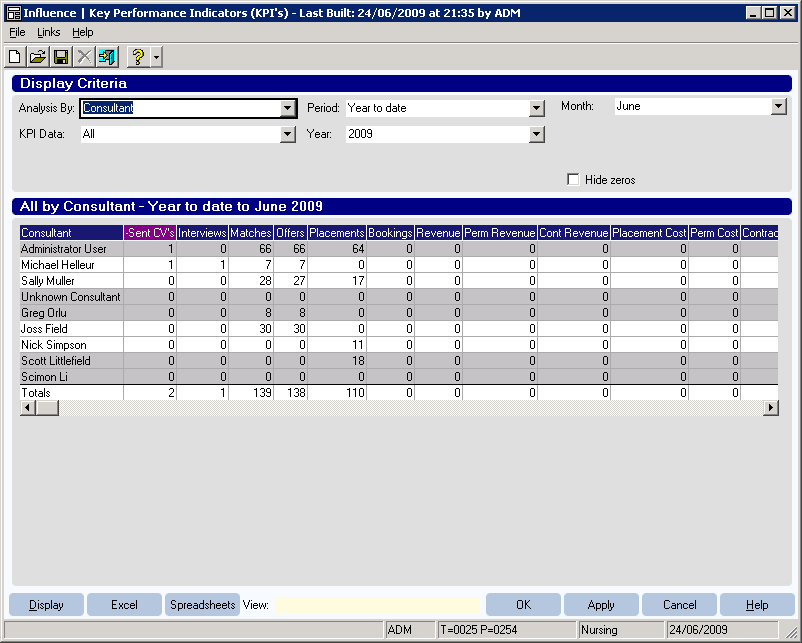
The system will display a screen from which you can select various options for listing the KPI’s. It is possible to view a huge variety of different metrics, and it is impossible to list all combinations here.
Within the View KPI Data screen, simply click on the drop-down to select the things you might want to see:
Common views of data are
| Analysis By |
Choose how you want to anayse your data, e.g. by Consultant, Team or Company, etc. |
| KPI Data |
Select what type of data you want to see, e.g. CVs sent, Matches Created, Calls made, Clients added, Candidates added, or 'ALL' which shows a whole range of items |
| Period |
The period over which you wish to view figures, e.g. Daily, Weekly, Monthly, Year-to-Date, Last-12-Months, etc. |
| Year |
Select the current year, or previous years (once suitable history exists!) |
| Month |
Which month to show. |
Example of KPI screen showing Figures "by Consultant"
How do I - Use and Produce KPI Data ?
The information screen shows the last-built date for the data in the title bar of the window, and thus any figures displayed only include actions performed prior to the stated date.
To view data simply make your criteria selections(s) then click the [Display] button (bottom left) to show the figures.
The figures shown on-screen can be exported to MS Excel simply by clicking the blue [Excel] button at the bottom left of the screen.
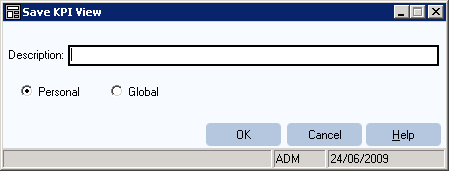
If particular views or criteria are regularly used they can be saved as ‘favourites’
Choose File > Save As
Use the dialogue box to give the view a name, and decide if this is a personal or ‘global’ favourite.
keywords: KPI Data, Key Performance Indicator, Build KPA
Martin Parkinson
Comments